Sometimes your Mac may not run as smoothly or as quickly as you expect. And the culprit may be a single application. A lone app can bump into performance issues, slowing down not just itself but your entire computer. An app may even freeze or become unresponsive to the point that you can’t close it the usual way. Whatever the problem, one tool that can help is Activity Monitor.
Built into macOS, Activity Monitor shows you a list of all running apps and processes and reveals the biggest hogs based on CPU, memory, energy use, disk use, and network bandwidth. And if a specific app is unresponsive and can’t be shut down the traditional way, you can force it to close. Here’s how it works.
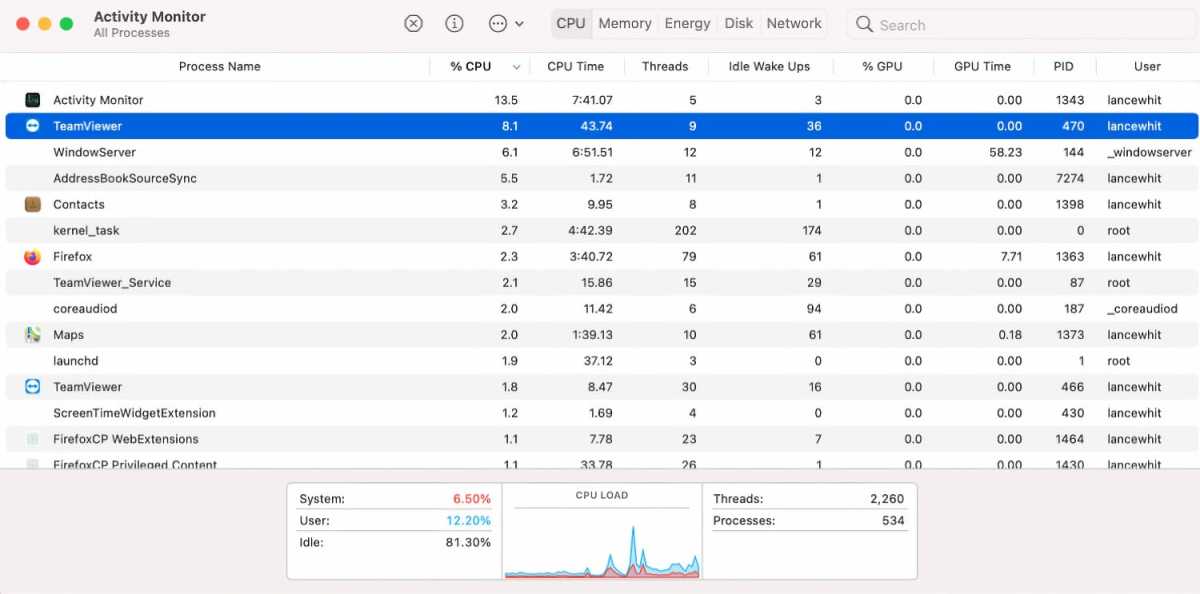
To open this tool from Finder, click the Go menu, browse to Utilities, and then launch Activity Monitor in the window that appears. The utility starts by showing every running app and process based on CPU resources. Each column for CPU shows a useful result, but the stats for CPU percentage are the most helpful for app troubleshooting.
You can sort the list of apps based on the highest or lowest numbers by clicking on the heading of each column. A graph at the bottom displays the total numbers for CPU percentage and other factors.

Activity Monitor can provide insight as to what apps are using the most resources on your Mac.
IDG
Monitored activities
You can switch views by clicking the tab in the upper right of the Activity Monitor. CPU is the first tab, and the default view the app opens.
On Macs with a discrete graphics processor, the GPU section appears after CPU. This shows which apps are the most demanding on your graphics processor.
The Memory screen shows the amount of memory used by each running app so you can find any chewing up more than its fair share. The bottom of the screen reveals the total and used amount of memory on your Mac. The stat for Swap Used can tell you if your Mac is copying too much data between physical memory and your hard drive’s swap file, a sign that you might need more RAM.
The Energy screen is of value on a laptop as it reveals which apps are consuming the most juice from your battery. The bottom of the screen displays the overall energy impact and the battery charge.
The screen for Disk tells you how much disk activity an app is generating in terms of data written to and read from the disk.
The screen for Network reveals how much network bandwidth an app is using.
Troubleshooting performance
For troubleshooting slow or unstable apps, the screens for CPU and Memory are generally the most helpful. If an app is using so many resources that it’s slowing down your computer, try closing it to see if your Mac bounces back.
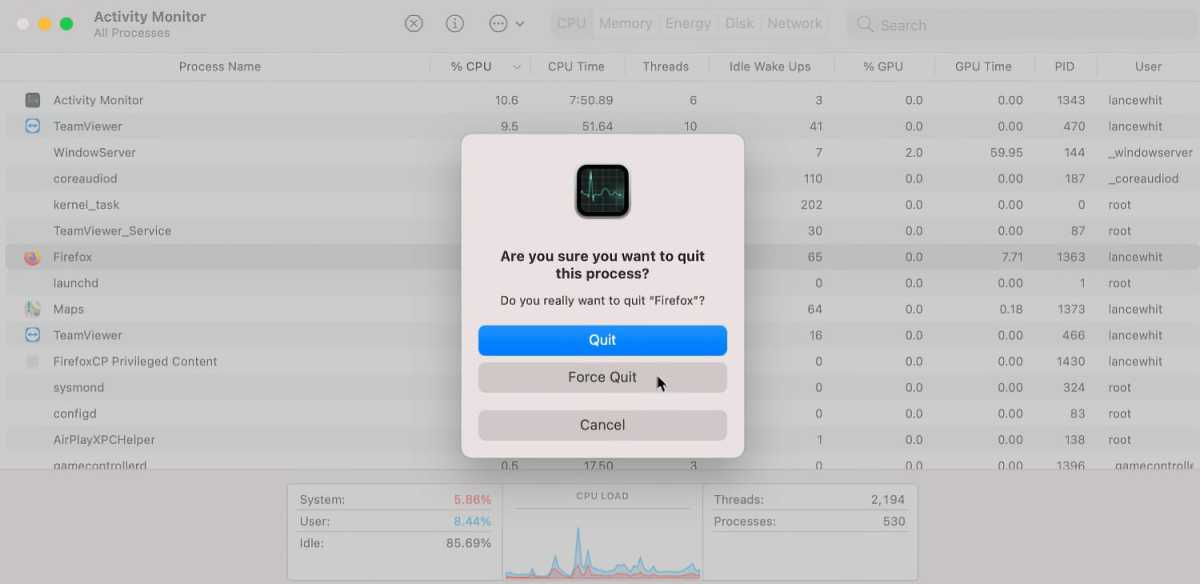
If the app refuses to shut down the normal way within the app, select it in Activity Monitor and click the Stop button (the octagon with an X) at the top. Then in the pop-up that appears, click Quit to see if the app shuts down without any fuss. If not, click the Force Quick button to force the app to close.

You can stop apps from running from within Activity Monitor.
IDG


